
Receiving NOAA weather satellite images
When I learned that it is possible to receive images directly from weather satellites using a software defined radio dongle, I knew that was something I had to try one day.
I didn’t get to start trying it out myself until recently (Spring 2020), when I suddenly found myself with quite a bit of spare time.
I was very surprised to find that it isn’t that difficult and can be done cheaply. Here’s what I got after a weekend of fiddling around:
There’s some noise, sure, but seeing this image come out of the very basic set-up I’ll describe here was super exciting.
There are a lot of tutorials out there about receiving images from the American NOAA satellites. I followed this one for the most part.
Software defined radio
I ordered an RTL-SDR USB dongle with basic antenna kit and started experimenting.
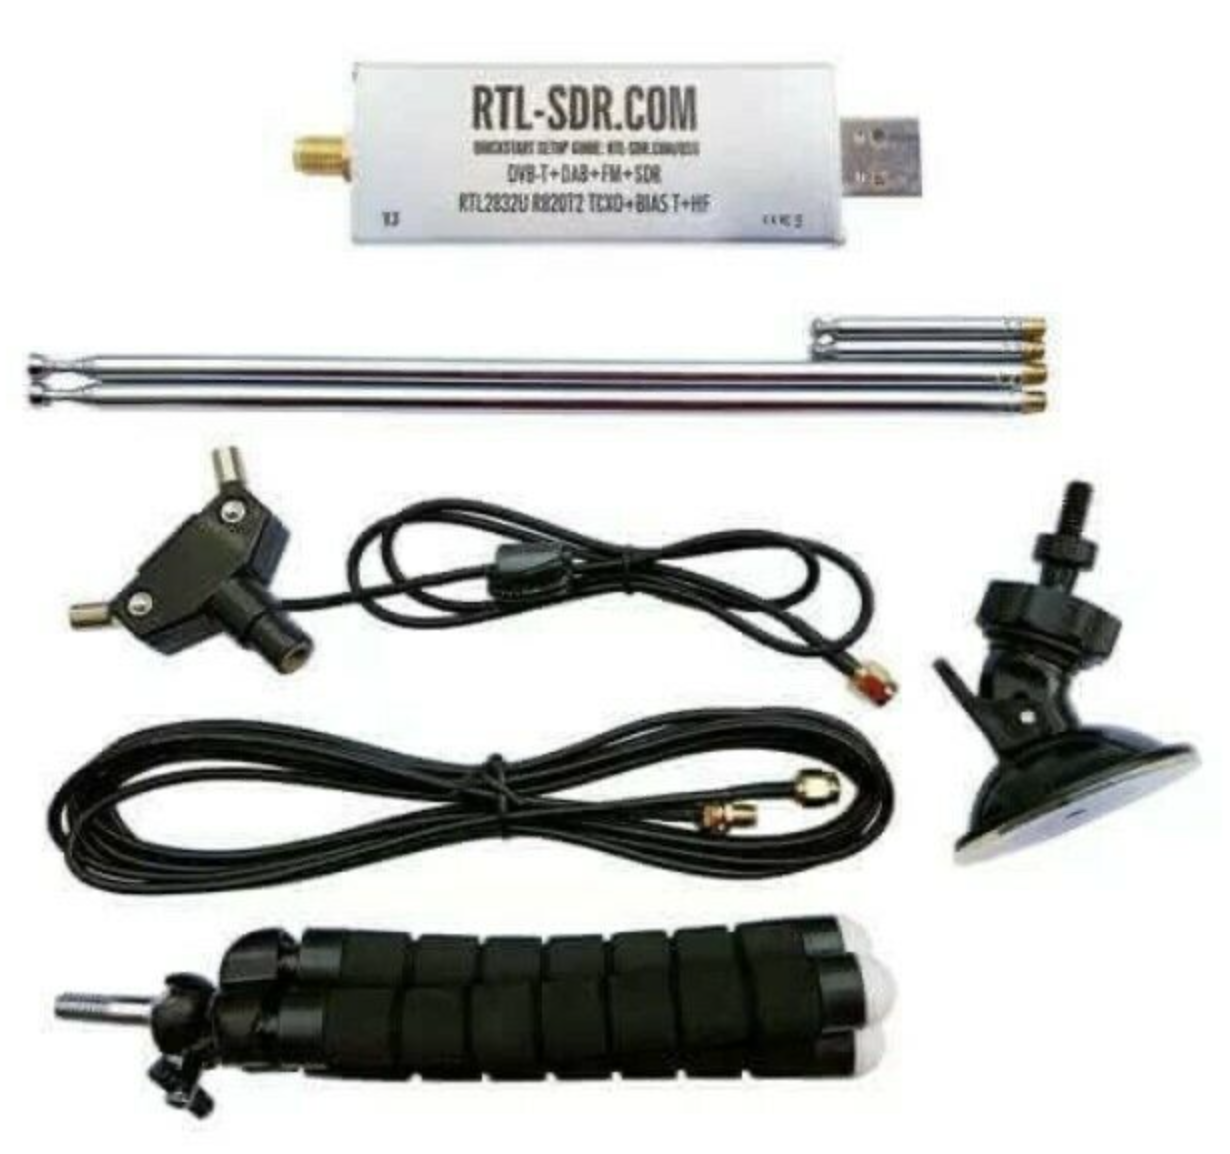
Installation was easy, I just followed the quick start guide on the rtl-sdr.com. I used the free software SDR#, which you can download here.
The antenna
It’s important to know that the NOAA satellites emit circularly polarized radio waves at about 137 MHz. Three satellites are still in operation right now:
| Satellite | Frequency |
|---|---|
| NOAA 15 | 137.6200 MHz |
| NOAA 18 | 137.9125 MHz |
| NOAA 19 | 137.1000 MHz |
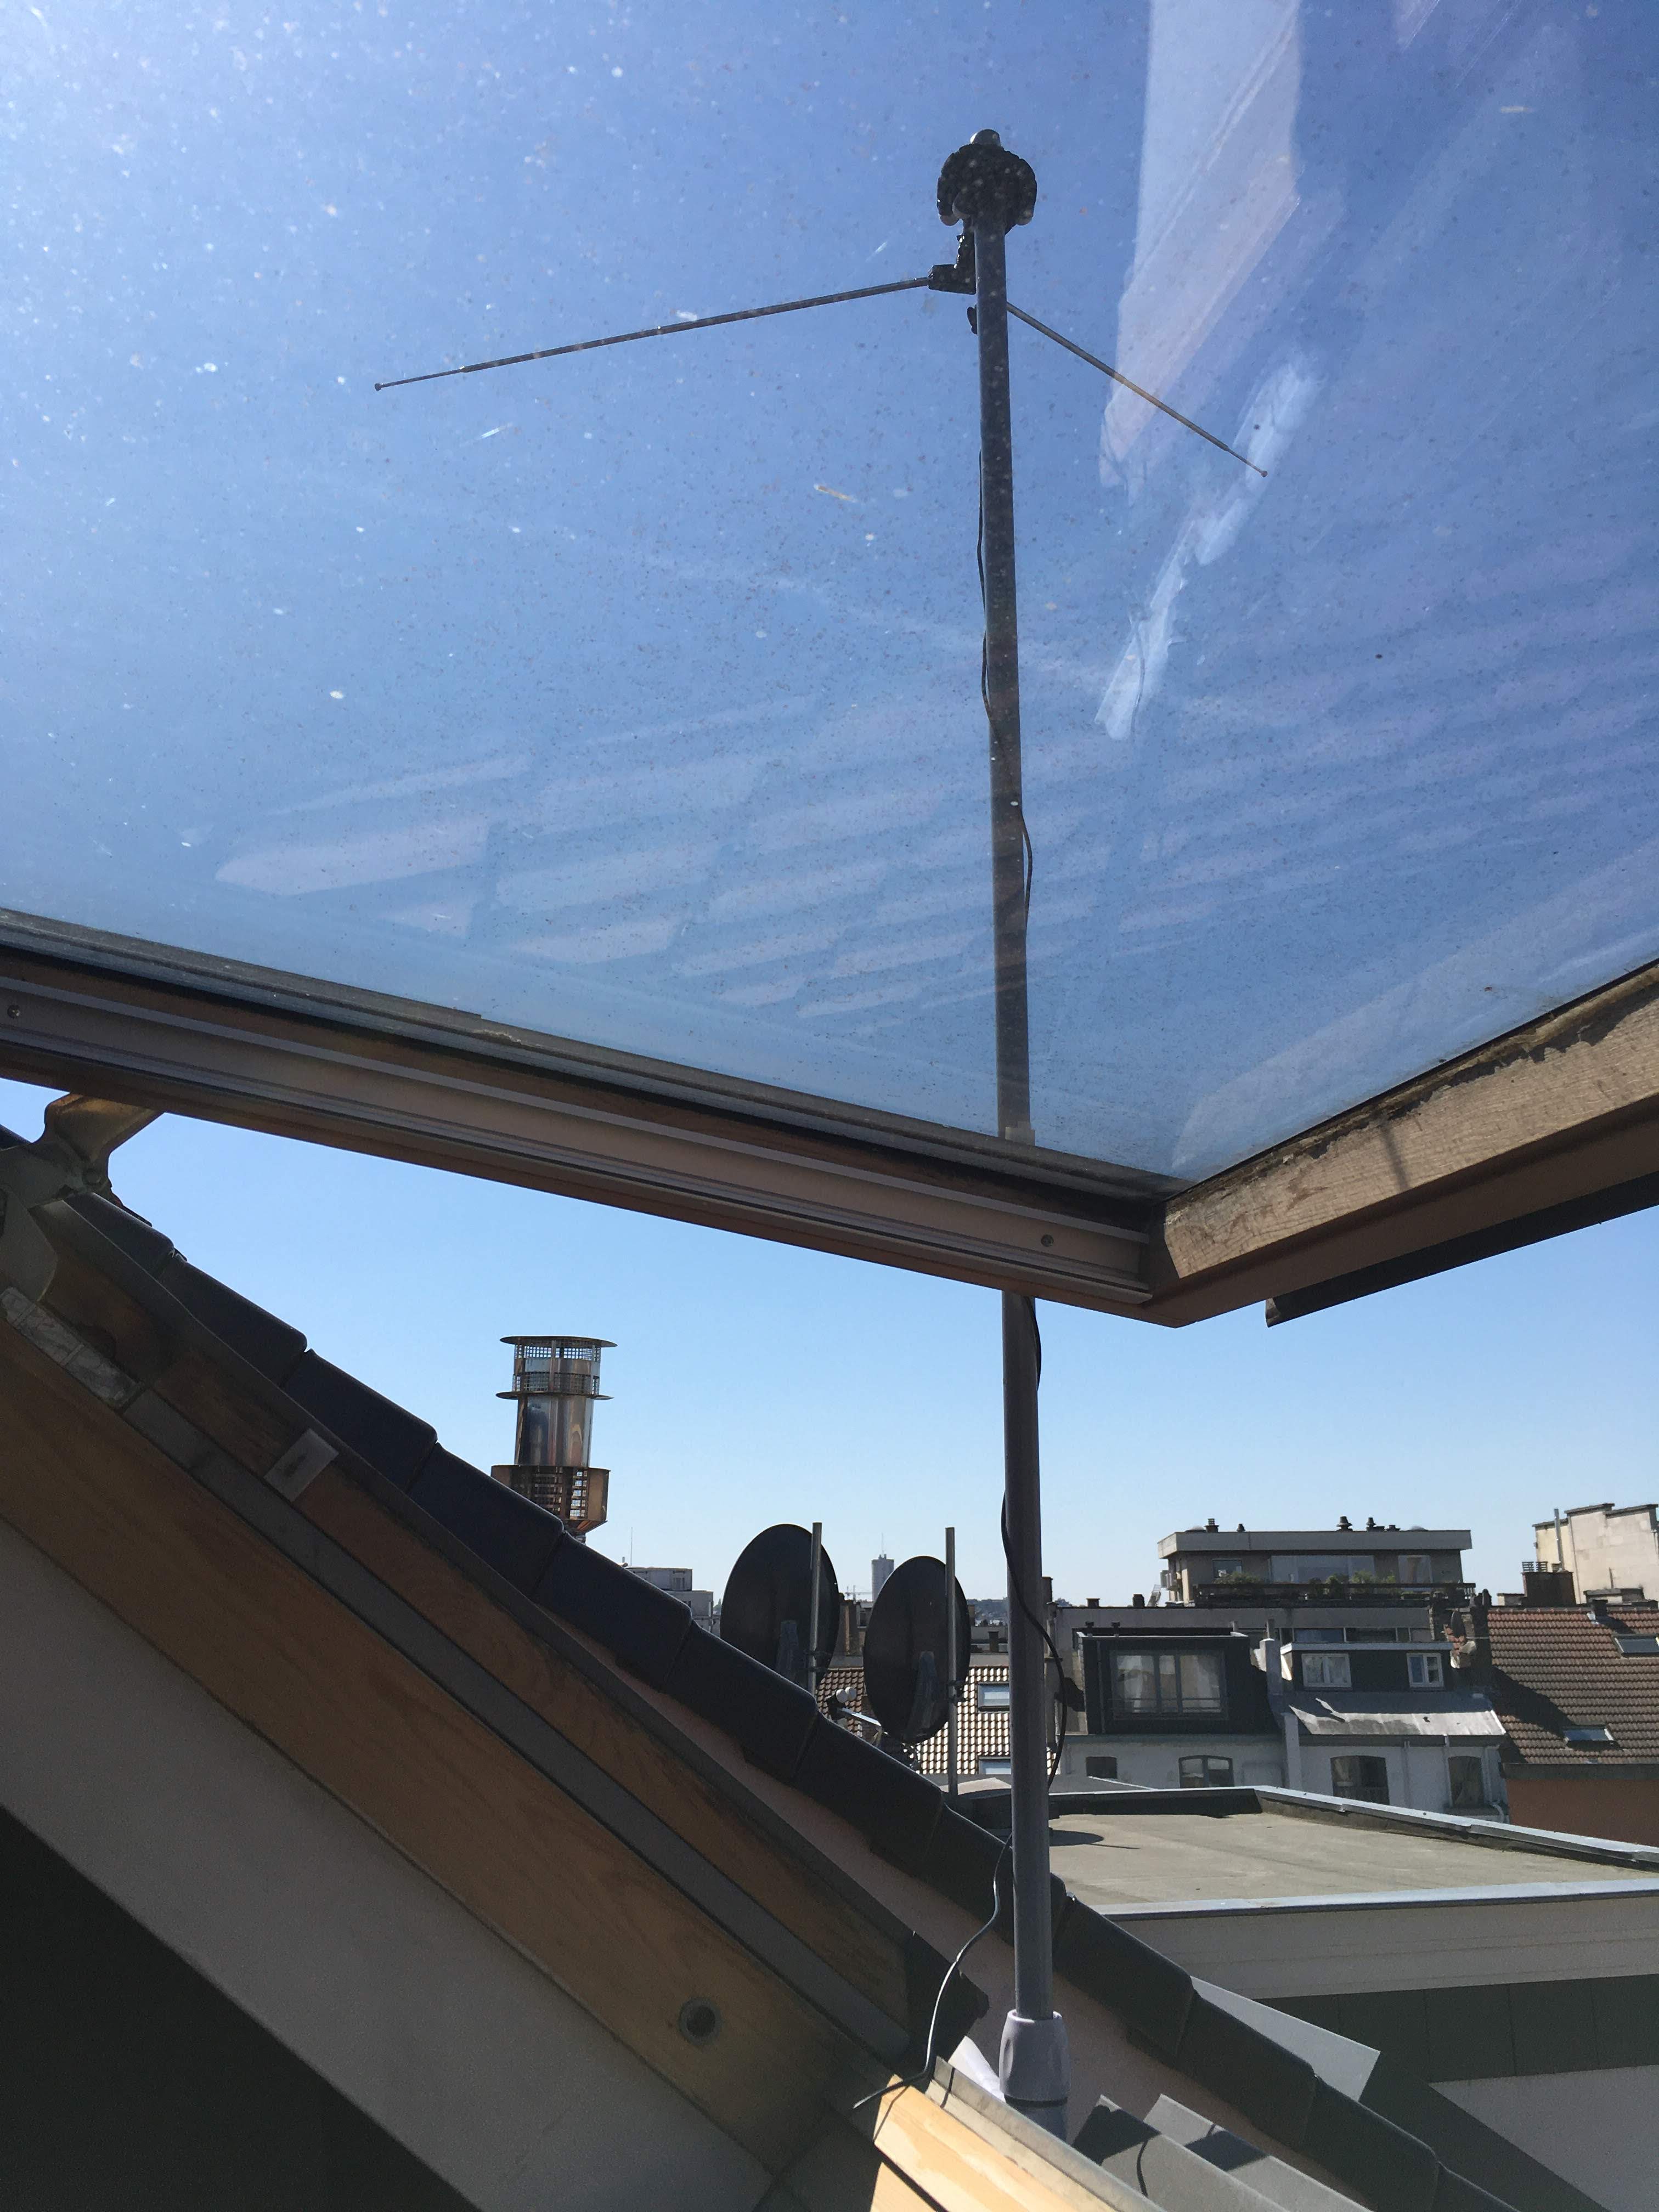
There are a few options for the antenna configuration, and it seems the quadrifilar helix (QFH) is quite popular. Having no access to tools to build one right now, I opted for the horizontal V-dipole configuration, which is detailed here.
I don’t really understand why the QFH gets so much attention, as it seems much easier to make the V-dipole using the dipole from the kit. I simply measured the angles such that the two telescopic parts make an angle of 120 degrees, and used a ruler to set their length to approximately 53.4 cm.
What’s also very useful about the V-dipole is that it will strongly attenuate FM radio broadcasts, which use vertically polarized radio waves. This was essential for me, as I live in the center of a city (Brussels) and within 500 meters of an FM broadcast tower. According to this blog post, the V-dipole will attenuate vertically polarized signals by 20 dB, while the QFH only attenuates them by 3 dB.
More details including the radiation pattern of the V-dipole are given here.
I mounted the antenna on a broomstick using the flexible camera tripod which comes with the kit, and placed it on the roof outside my window:
Finding the satellite
The NOAA weather satellites follow a polar orbit around the earth, so they can only be received when passing overhead. To find out when that happens, I used this page, hosted by AMSAT Argentina (click the green button next to “Weather Sats” on the right).
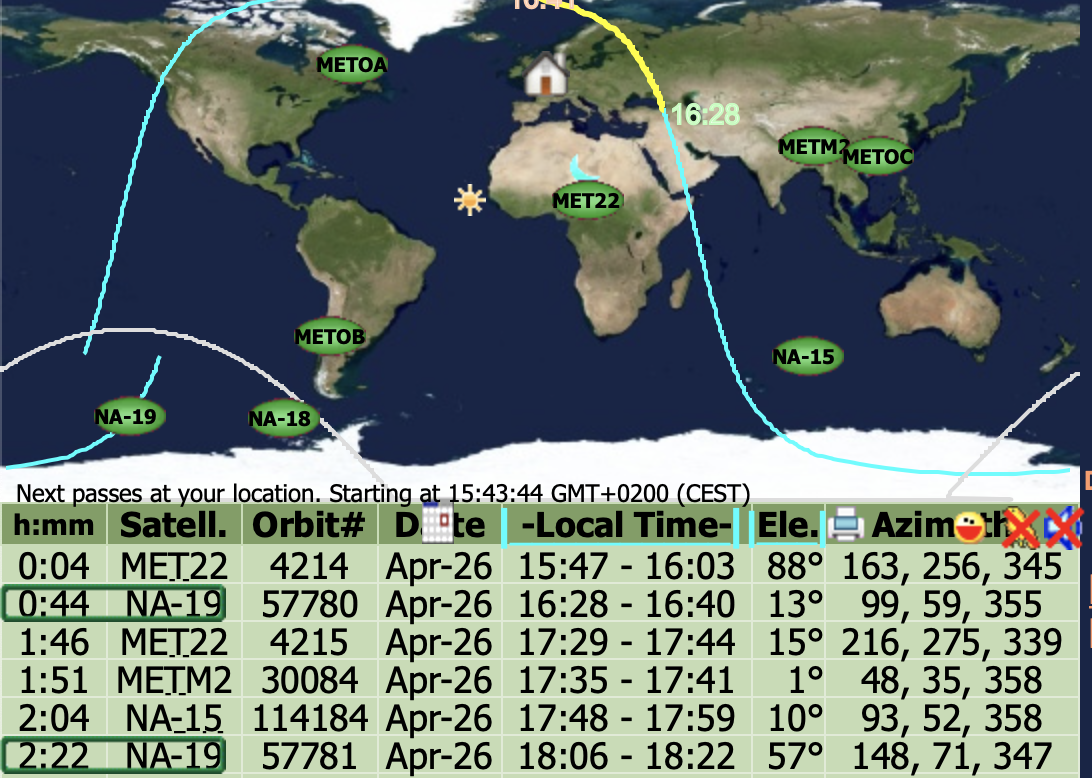
The webpage shows when the satellite comes into view, and it also shows the Doppler shifted frequency of the satellite. The Doppler shift is definitely not negligible, and it changes by several kHz during the fly-over.
Configuring SDR#
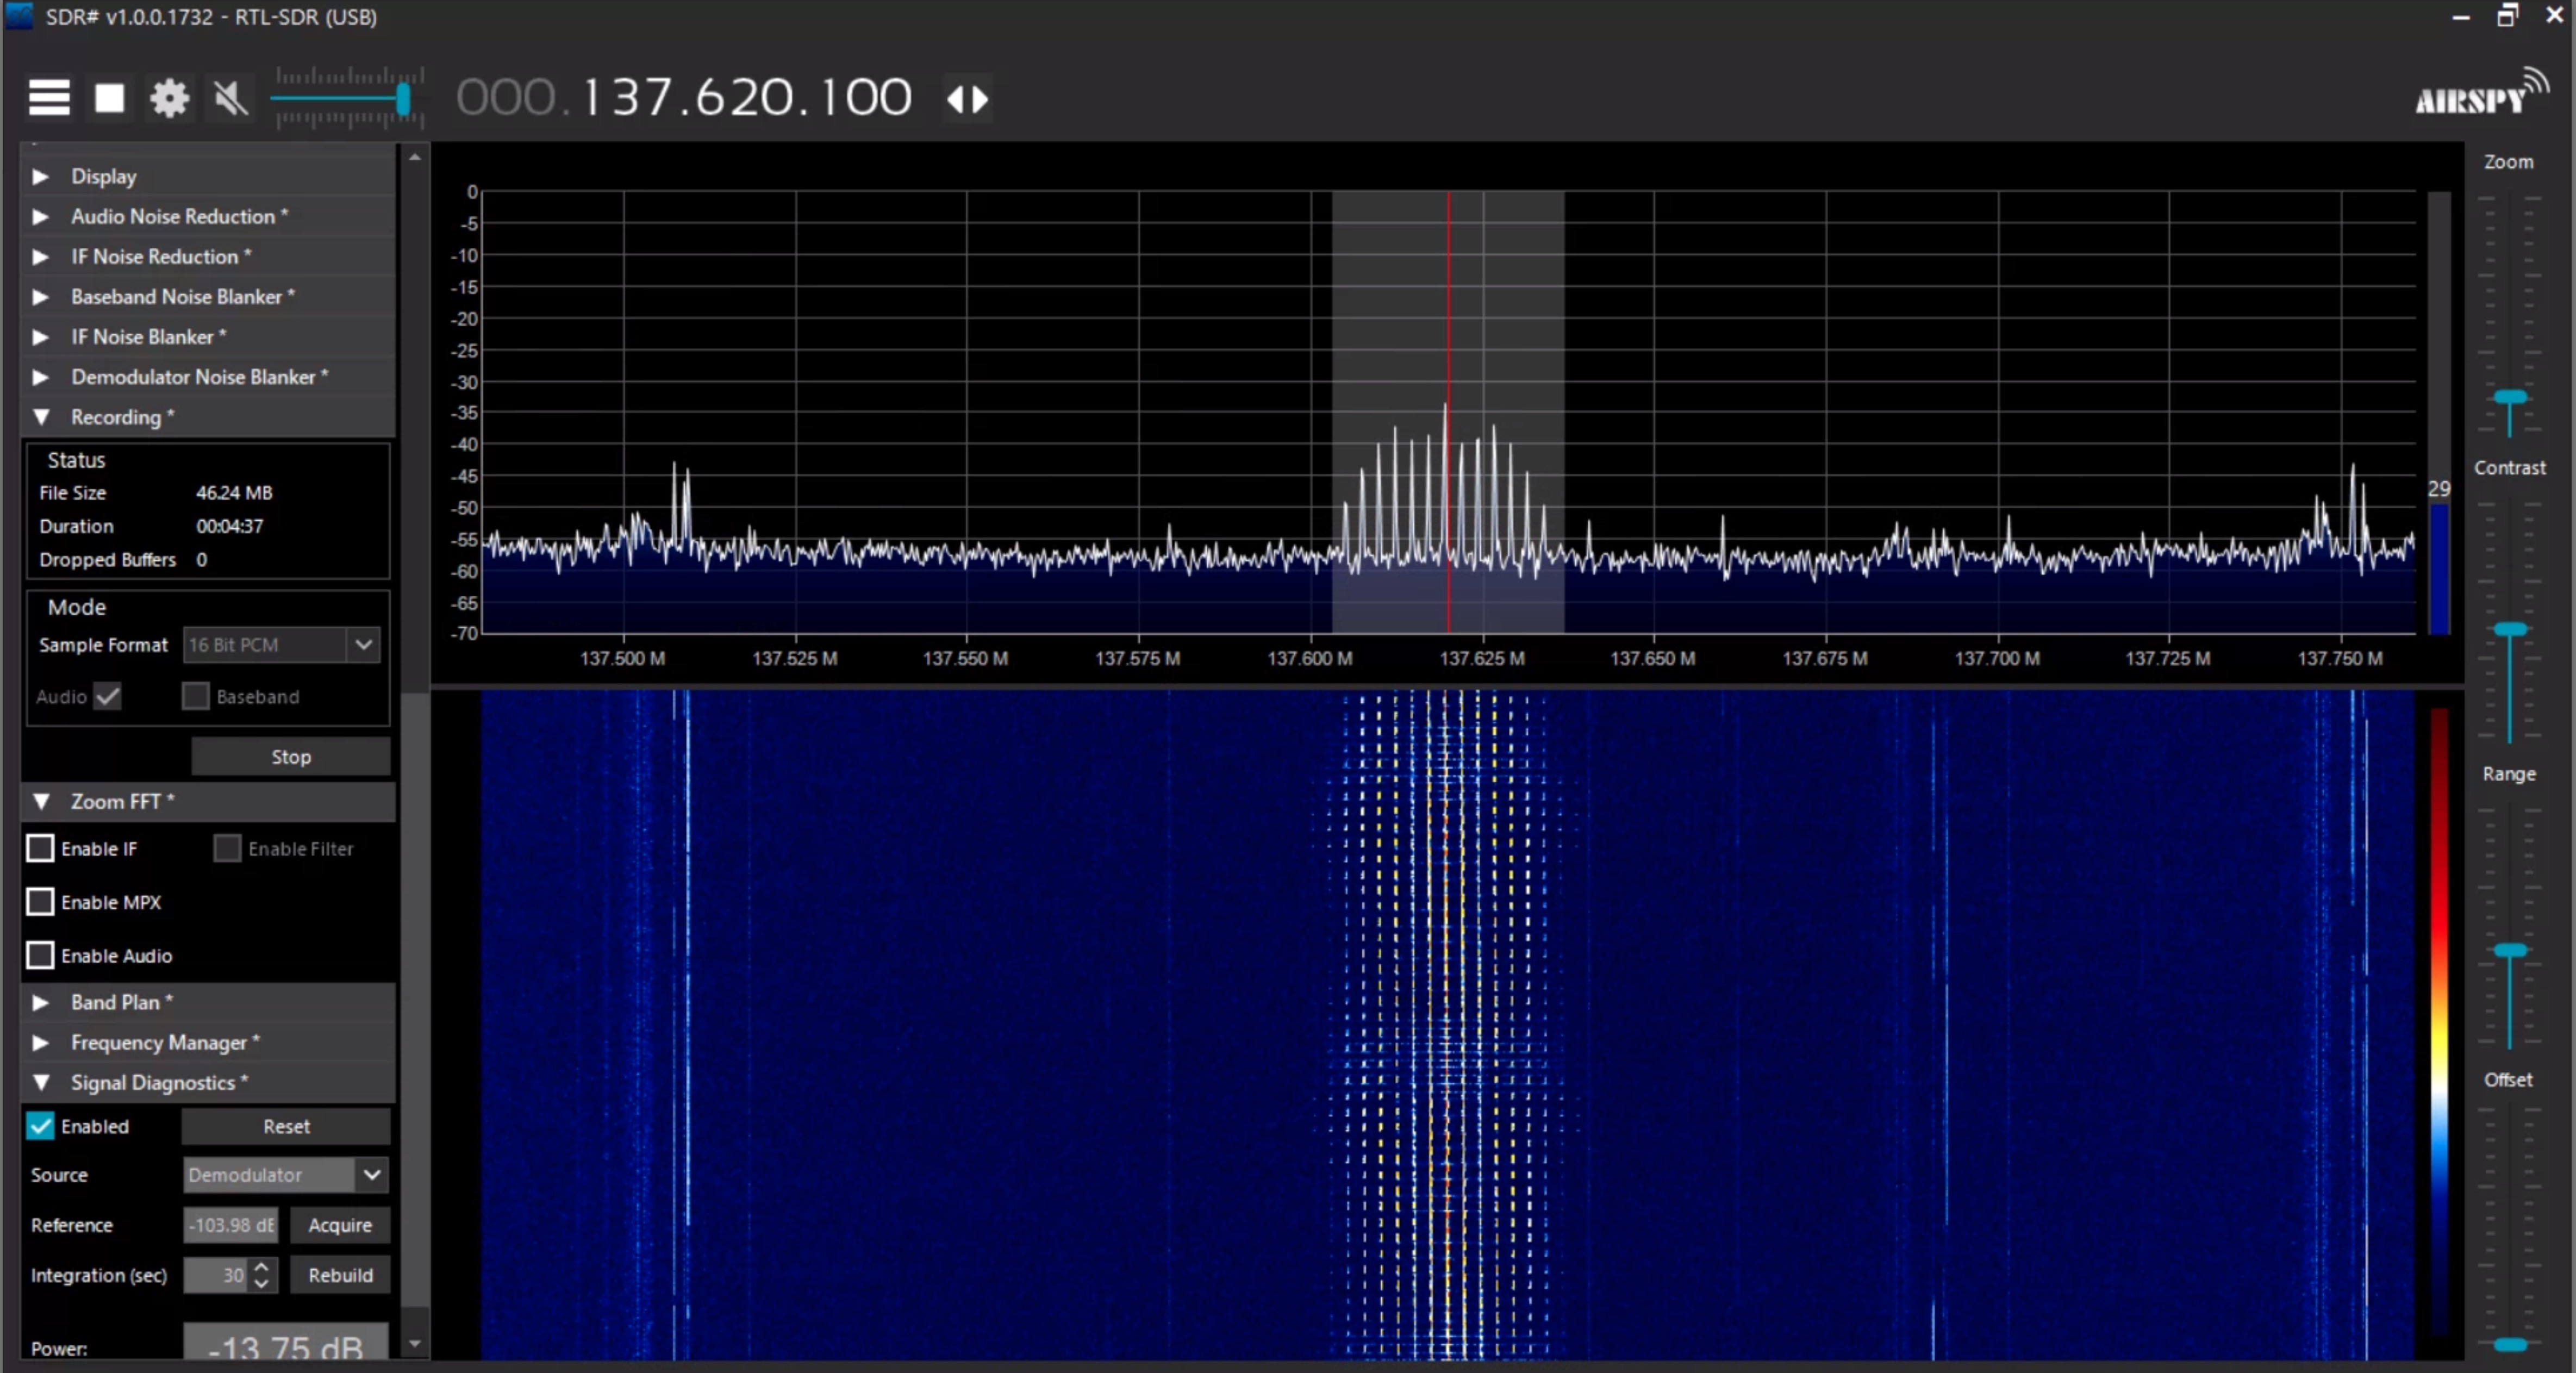
Following the tutorials, I set the radio mode to wide-band FM (WFM), with a bandwidth of 34 kHz. I used a sample rate of 1.4 Msamples/s, and no automatic gains (AGC). An RF gain of 29.7 dB gave the best SNR in my case. Since I’m using the V3 of the RTL-SDR dongle which has a more accurate crystal, I didn’t change the frequency correction setting.
When NOAA-15 was passing over, I first saw the typical FM spectrum starting to appear on the waterfall plot (see below). I recorded the audio signal using SDR# (16 bit PCM, although 8-bit would probably have sufficed). When the satellite was directly overhead, I switched on my speakers and could hear the beautiful whistle and metronome-like sound emitted by the satellite.
Images from sound
NOAA satellites encode their images using the analog Automatic Picture Transmission (APT) system.
In most of the tutorials I found, a program called WxtoIMG is used to convert the sound recordings into images. However, the WxtoIMG installer didn’t work for some reason on my PC (antivirus maybe?), so I used NOAA-APT instead. That program is open source, and worked very easily: just open the .wav audio recording and click “Start”.
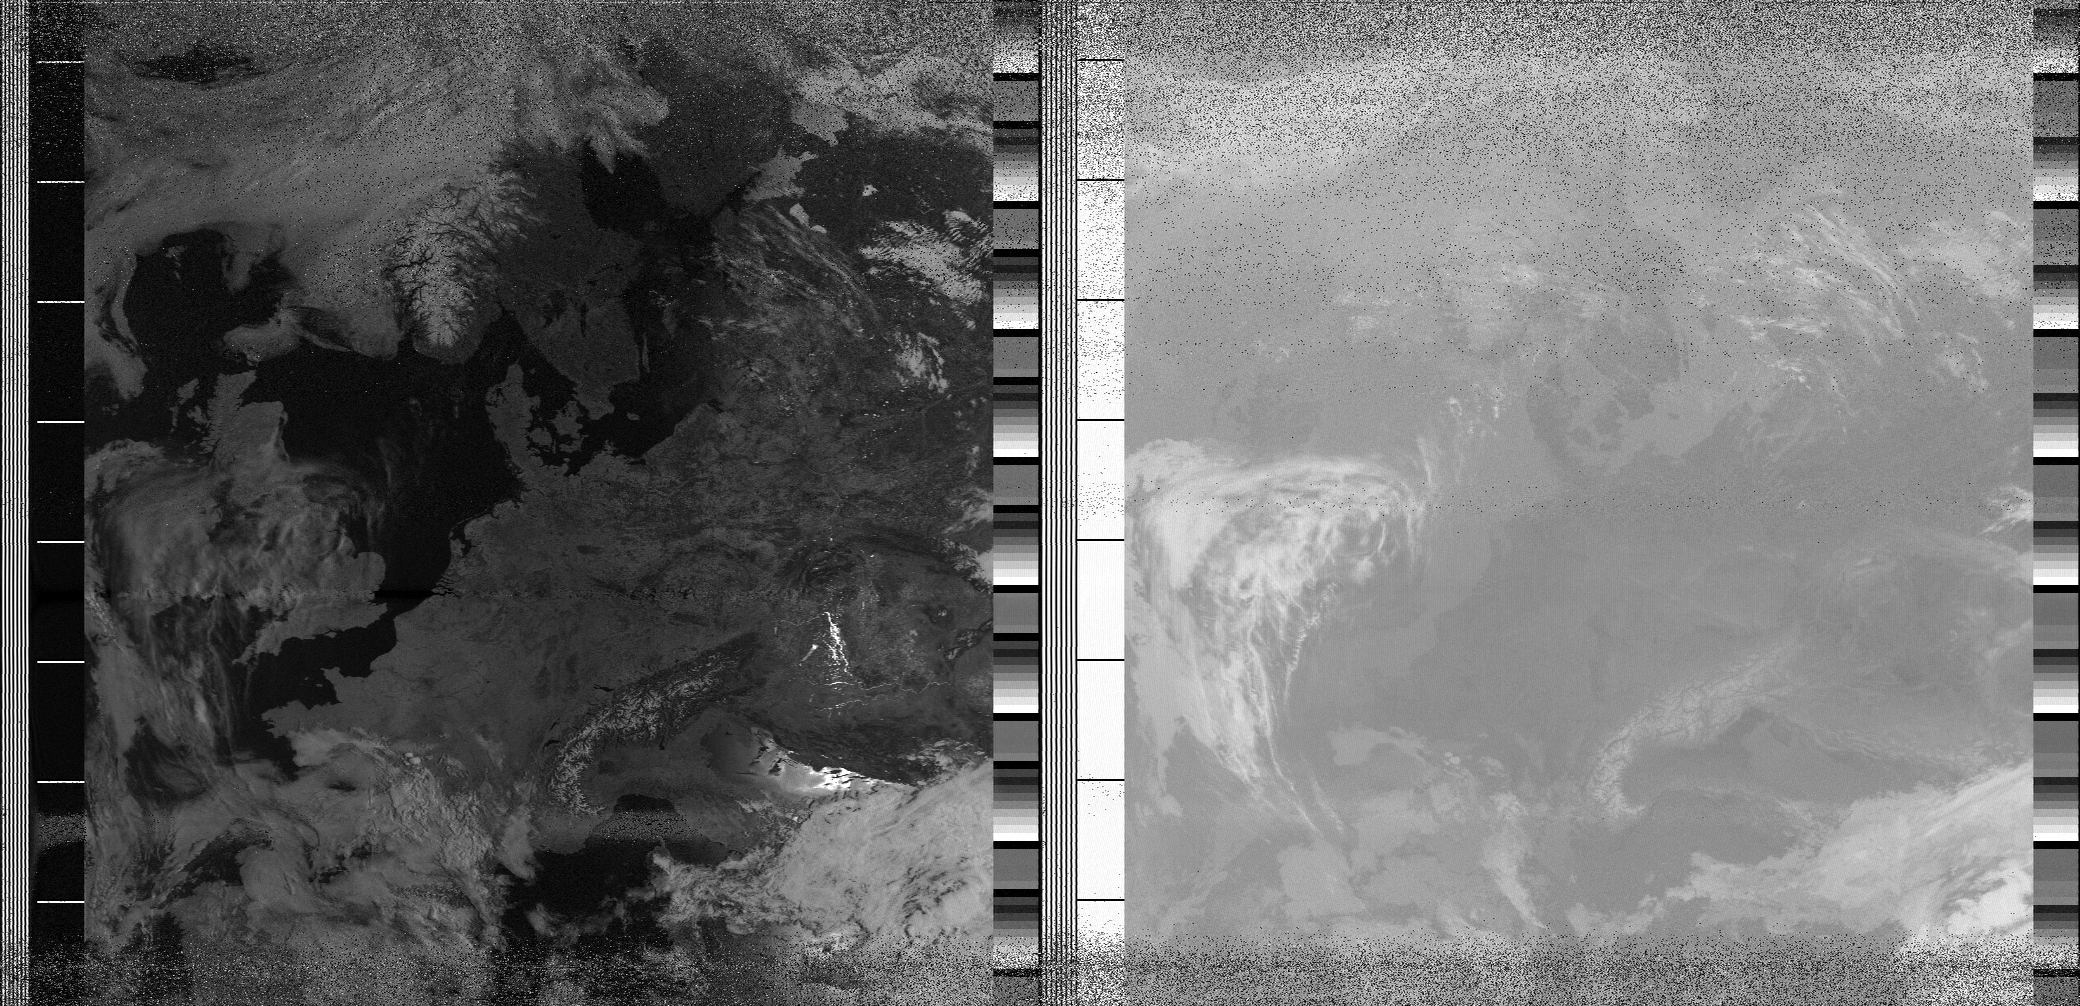
This image came out:
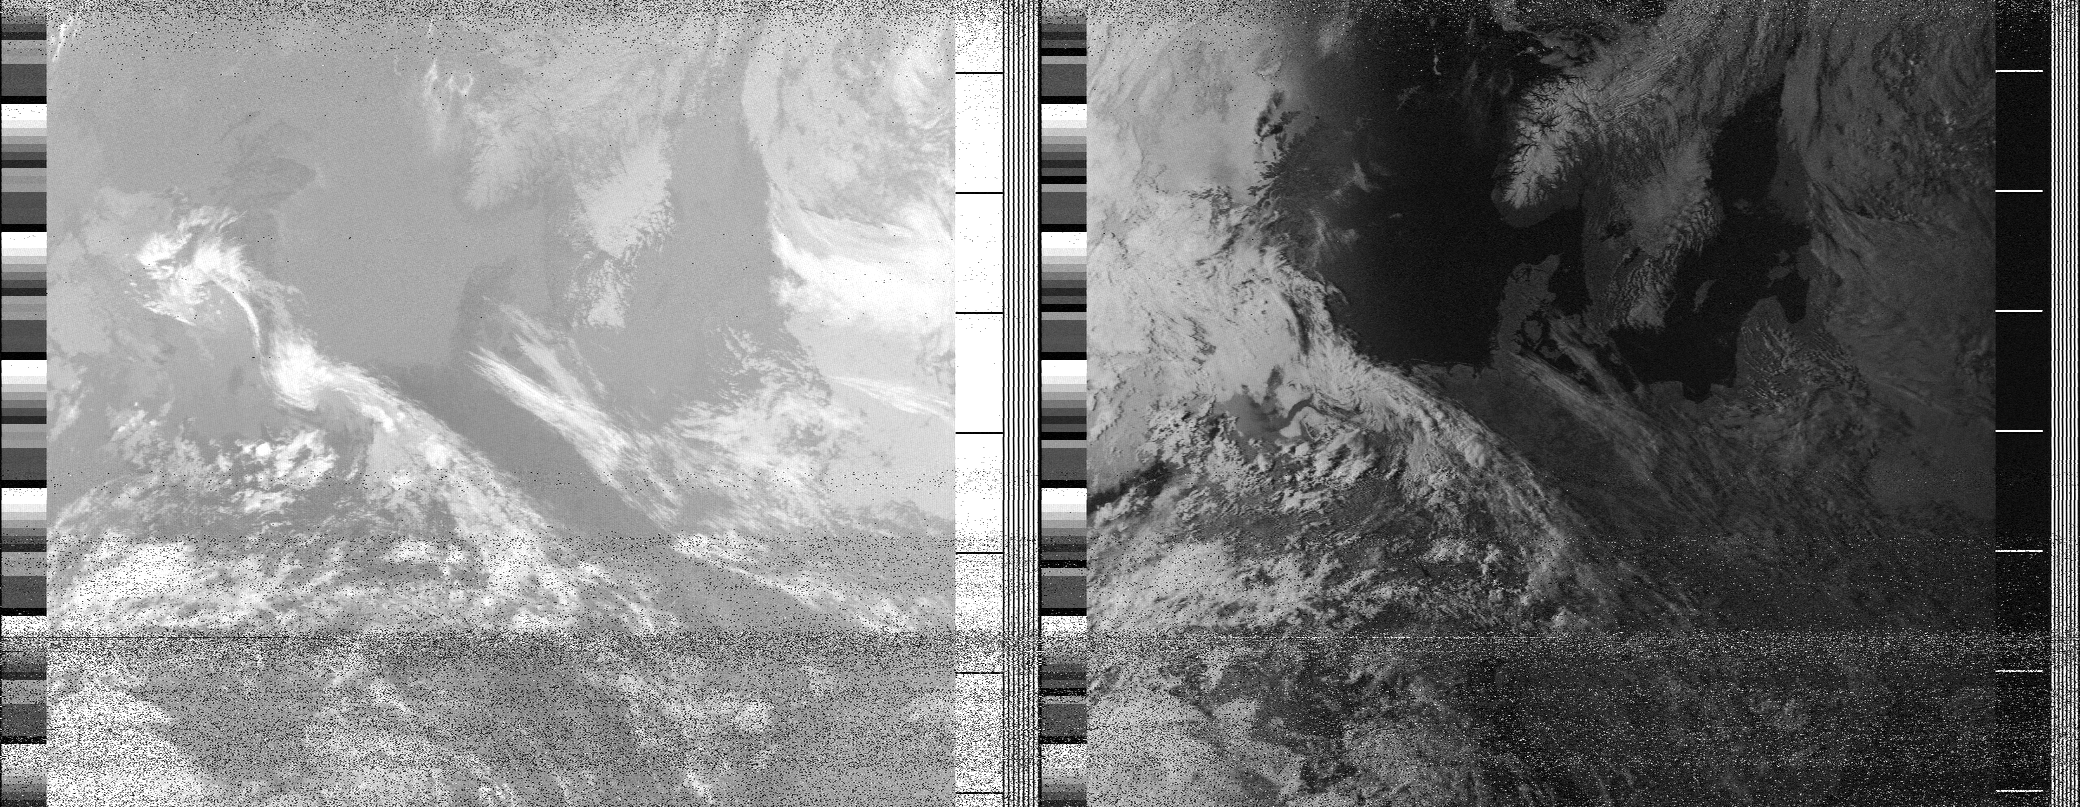
I was (and still am) totally mesmerized by it. I never realized what a beautiful shaped Denmark has, or how snowy Norway still is this time of year (April).
A day later, I recorded an even cleaner signal, and got this image:
Next steps
There are a couple of things I’d like to improve.
-
First, I want to improve the SNR a bit more. Right now, I’m picking up a useable signal when the satellite reaches 25 degrees above the horizon or so. I’m hoping that with an LNA and FM-bandstop filter, I’ll be able to get some more SNR and suppress the FM radio interference I’m seeing when increasing the gain beyond 29.7 dB.
-
When I’ll be able to get out of the house, I’d like to try if I can get a less obstructed view of the horizon and record larger images. Right now, I’m surrounded by other buildings which block large parts of the horizon.
-
Finally, I’d really like to do the decoding of the image myself, probably in Python.